Chapter 1 A brief introduction to R
1.1 What is R?
R is an object-oriented programming language and environment for statistical computing that provides relatively simple access to a wide variety of statistical techniques (R Core Team 2016). R offers a complete programming language with which to add new methods by defining functions or automating iterative processes.
Many statistical techniques, from the classic to the latest methodologies, are available in R, with the user in charge of locating the package that best suits their needs.
R can be considered as an integrated set of programs for data manipulation, calculation and graphics. Among other features R allows:
- effective data storage and manipulation,
- operators for calculation on indexed variables,
- a comprehensive, coherent and integrated collection of data analysis tools,
- plotting possibilities, which work directly on screen or printer, and
- a well-developed, simple and effective programming language, including conditionals, loops, recursive functions and the possibility of inputs and outputs.
R is distributed as open source software, so obtaining it is completely free.
R is also multiplatform software which means it can be installed and used in various operating systems (OS), mainly Windows and Linux. However, the available functions and packages syntax is practically the same in any OS. From an operational point of view, R consists of a base system and additional packages that extend its functionality. Among the main types of packags we found:
- Those that are part of the base system (ctest).
- Those that are not part of the base system, but are recommended (survival, nlme). In GNU/Linux and Windows these packages are already part of the standard distribution.
- Other packages such as UsingR, foreing, or Maptools. These must be selected and installed individually. We will see how to do this later.
The functions included in the packages installed by default, that is, those that are predefined in the basic installation R, are available for use at any time. However, in order to use the functions of new packages, specific calls must be made to those packages.
1.1.1 Getting and installing R
The installation of R depends on the operating system to be used. You can find all the necessary information in:
- http://cran.r-project.org/
- Windows: http://cran.r-project.org/bin/windows/
- Linux: http://cran.r-project.org/bin/linux/
For the development of this course I will use the Windows version but feel free to use whatever version fits your needs. The last version of R is downloadable from here. We will install the latest version available. Remember that you have to install the version that corresponds to the architecture of your OS (32 or 64 bits). In case of doubt install both versions or at least the 32-bit version, which will always work on our computer.
Installation in Windows is very simple. Just run the executable (.exe) file and follow the installation steps (basically say Yes to everything). Once R is installed, we will install RStudio an integrated development environment (IDE) that is more user-friendly than the basic R interface. RStudio provides a more complete environment and some useful tools such as:
- Autocomplete instructions1.
- Object management.
- Data display and visualization.
- Exporting plots and figures.
We will install the latest version of RStudio. You can see the installation steps in the installation video tutorial.
- Note that RStudio is just an interface. Any code block or instruction will work in any other R environment.
- Before installing RStudio you need to have already installed the standard R software.
1.1.2 Documentation, manuals and help
Being an open source software and with a strong collaborative component R has a large amount of resources and documentation relative to the specific syntax of the language itself (control structures, function creation, calls to objects …) and to every single package available as well.
On the other hand, R counts on a series of manuals which are available right after installing the software. You can find them in the installation directory of R (C:Files-X.X.X). These manuals and many others can also be downloaded from the R project website:
- Writing R extensions.
- R data import / export.
- The R language definition.
- R installation and administration.
- An introduction to R.
Finally, in addition to the wide repertoire of manuals available, there is also a wide range of resources and online help including:
- http://www.r-bloggers.com/. A website dedicated to R development of tutorials.
- http://www.r-project.org/mail.html. R help mailing lists with various interest groups including the R (r-sig-geo) GIS user community.
- http://stackoverflow.com/. Website devoted to questions-and-answers on programming languages among which is R also available2.
- http://www.r-tutor.com/. A website devoted to teach statistics. An useful one if you are not much familiar with basic statistical methods.
It is relatively important to become familiar from the beginning with the various alternatives for getting help. A key part of your success in using R lies in your ability to be self-relient and be able to get help and apply it to your own problems.
1.2 Starting with R
1.2.1 The R environment
R is basically a command line environment that allows the user to interact with the system to enter data, perform mathematical calculations or visualize results through plots and maps.
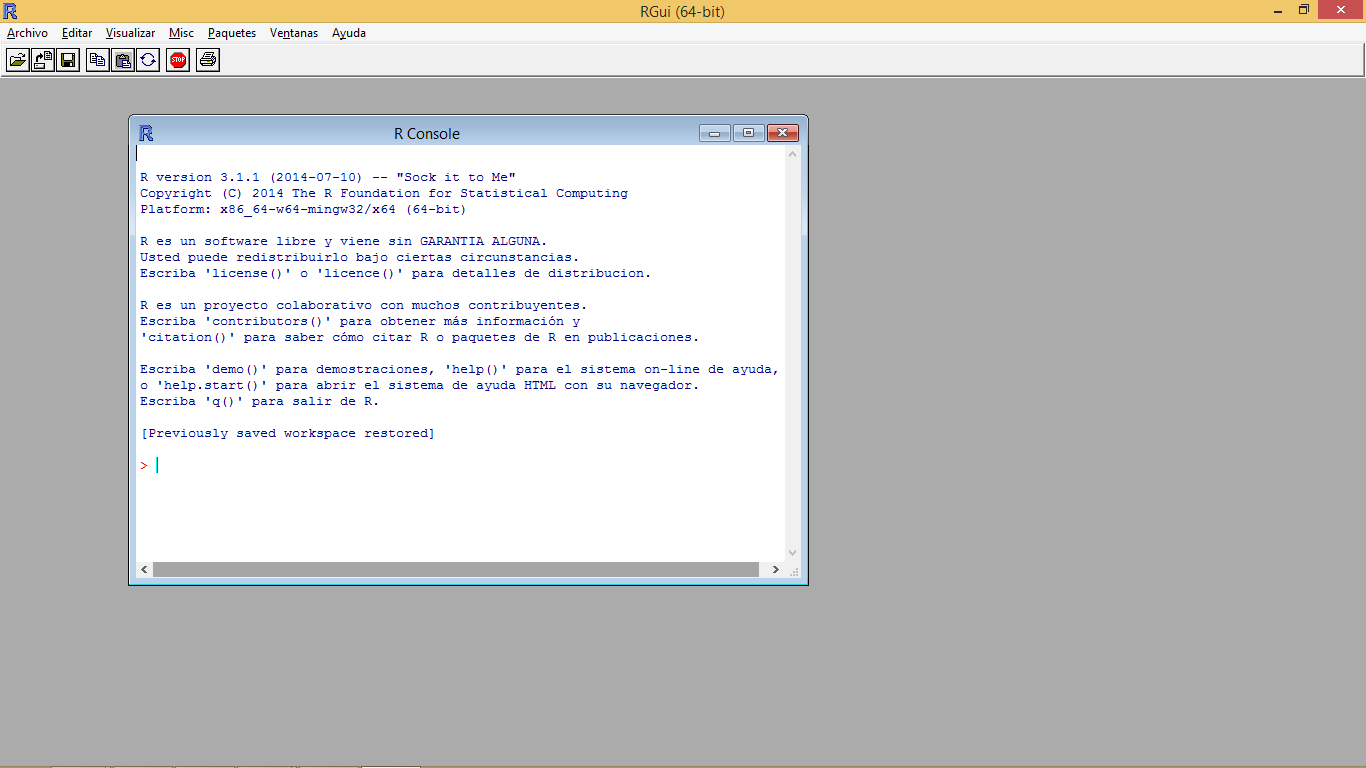
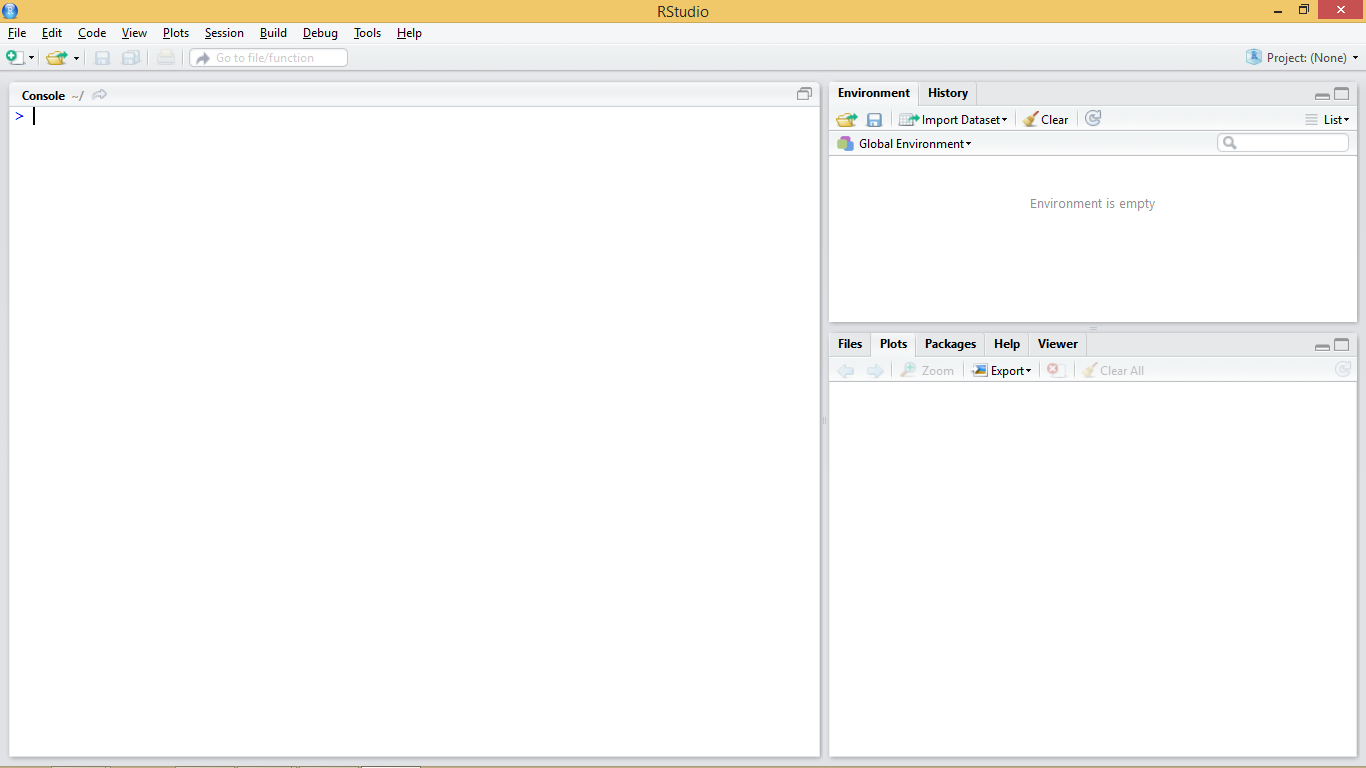
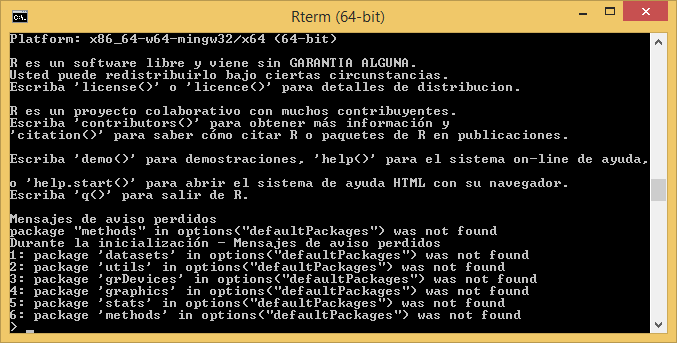
Figure 1.1 shows the standard appearance of the R console, which can be considered as a windows cmd like terminal or console. We have also seen what the terminal and working environment looks like in RStudio at the end of the installation process (Figure 1.2). A third possibility is to work directly on the cmd terminal (Figure 1.3). The commands and instructions are the same regardless of the environment that we chose. In this course we will focus on the use of RStudio, since it is the simplest of them all.

Figure 1.1: R standard terminal

Figure 1.2: RStudio interface

Figure 1.3: R cmd terminal
The terminal (regardless of the chosen option) is usually the main working window and is where we will introduce the necessary instructions to carry out our operations. It is in this window where we will visualize the results from most instructions and objects we generate. An exception to this are plots and maps which are displayed in a specifically-devoted window located in the bottom-right corner.
1.3 Working with R
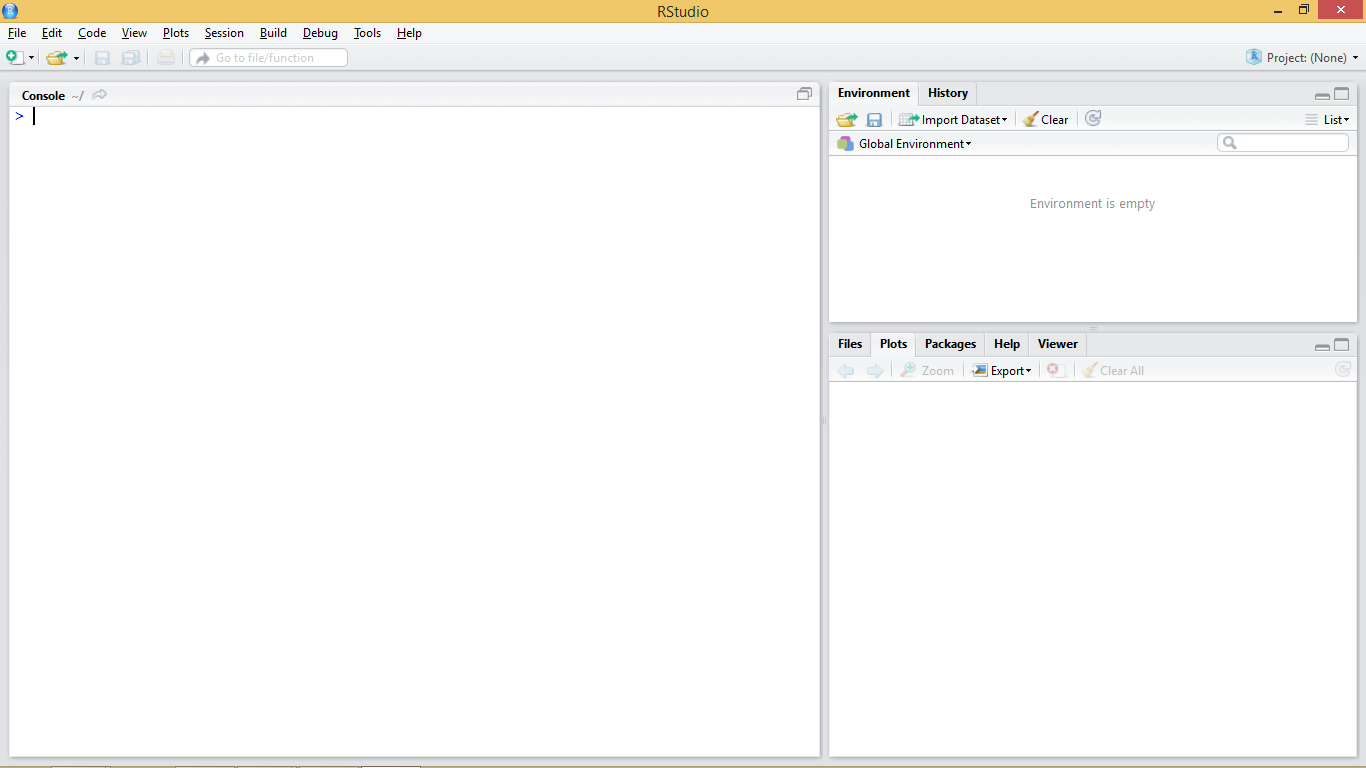
Let’s get started and insert our first command in the R’s terminal. When R is ready or awaiting us to input an instruction the terminal shows a cursor right after a > symbol to indicate it.

Figure 1.4: R waiting for instructions
At this point it is necessary to take into account that R is an interpreted language, which means that the different instructions or functions that we specify are read and executed one by one. The procedure is more or less as follows. We introduce an instruction in the R console, the application interprets and executes it, and finally generates or returns the result.
To better understand this concept we will do a little test using the R console as a calculator. Open the working environment of RStudio if you did not already open it and enter the following statement and press enter:
10+2## [1] 12What just happened is that the R interpreter has read the instruction, in this case a simple arithmetic operation, executed it and returned the result. This is the basic way to proceed to enter operations. However, it will not be necessary for us to always enter the instructions manually. Later we will see how to create scripts or introduce blocks of instructions.
1.4 Objects in R
We have previously mentioned some features of R such as that R is an object-oriented language. But, what does this mean? It basically means that to perform any type of task we use objects. Everything in R is an object (functions, variables, results …). Thus, entities that are created and manipulated in R are called objects, including data, functions and other structures.
Objects are stored and characterized by their name and content. Depending on the type of object we create that object will have a given set of characteristics. Generally the first objects one creates are those of variable type, in which we will be able to store a piece of data and information. The main objects of variable type in R are:
- Number: an integer or decimal number depending on whether we specify decimal figures.
- Factor:a categorical variable or text.
- Vector: a list of values of the same type.
- Array: a vector of \(k\) dimensions.
- Matrix: a particular case of array where \(k = 2\) (rows, cols).
- Data.frame: table composed of vectors.
- List: vector with values of different types.
Obviously there are other types of objects in R. For example, another object with which we are going to familiarize ourselves is the model objects. We can create them by storing the output of executing some kind of model like a linear regression model for instance. Spatial data also fits in its particular variety of objecto. Thororugh the course we will see both models and spatial information (vector3 and raster).
1.4.1 Creating objects
Objects in R are created by declarating a variable by specifing its name and then assign it a value using the <- operator. We can also use = but the <- operator is most commonly found in examples and manuals.
So, to create an object and assign it a value the basic instruction is composed of object name <- value.
n <- 4Prueba a introducir las siguientes instrucciones para crear distintos tipos de objeto:
n <- 15
x <- 1.0
name <- "Marcos"
We can also store in an object the result form any operarion:
n <- 10+2So here is the thing. The type of object we create depends on the content that we assign. Therefor, if we assign a numeric value, we are creating an object of type number (integer or decimal) and if we assign a text string (any quoted text, either with single or double quotes), we are creating a text type object or string. Once created, the objects are visualized using calls using the name that we have assigned to the object. That is, we will write to the terminal in the name of the object and then its value will be shown.
n## [1] 12name## [1] "Marcos"Some considerations to keep in mind when creating objects or working with R in general lines:
- R is case-sensitive so radio ≠ Radio
- If a new value is assigned to an object it is overwritten and deletes the previous value.
- Textual information (also knwon as string or char) is entered between quotation marks, either single (
'') or double (""). - The function
ls()will show us in the terminal the objects created so far. - If the value obtained from an instruction is not assigned in an object it is only displayed in the terminal, it is not stored.
1.4.2 Vectors
One of the most common objects in R is the vector. A vector can store several values, which must necessarily be of the same type (all numbers, all text, and so forth). There are several ways to create vectors. Try entering the following instructions and viewing the created objects:
v1 <- c(1, 2, 3, 4, 5)
v1
## [1] 1 2 3 4 5v2 <- 1:10
v2## [1] 1 2 3 4 5 6 7 8 9 10v3 <- -5:3
v3## [1] -5 -4 -3 -2 -1 0 1 2 3v4 <- c('spatial','statistics','rules!!')
v4## [1] "spatial" "statistics" "rules!!"We have just covered the basic methods for vector creation. The most common approach is use the function c() which allow as to introduce values manually by separatting them using ,.
v1 <- c(1, 2, 3, 4, 5)
v1## [1] 1 2 3 4 5v4 <- c('spatial','statistics','rules!!')
v4## [1] "spatial" "statistics" "rules!!"Another option that only works for vectors contaning integer values is the use of : which produces a ordered sequence of numbers by adding 1 starting from the first value and finishing in the last.
v2 <- 1:10
v2
## [1] 1 2 3 4 5 6 7 8 9 10v3 <- -5:3
v3## [1] -5 -4 -3 -2 -1 0 1 2 3Vectors, lists, arrays, and dataframes are indexed objects. This means that they store several values and assign to each of them a numerical index that indicates their position within the object. We can access the information stored in each of the positions by using name[position]:
v1[1]## [1] 1Note that opposite to most of the other programming languages, the index for the first position in an indexed object is 1, whereas Python, C++ and others use 0.
As with an unindexed object, it is possible to modify the information of a particular position using the combination name[position] and the assignment operator <-. For example:
v3[9] <- 10000
v3[9]
## [1] 10000Let’s see some specific functions and basic operations for vectors and other indexed objects:
length(vector): Returns the number of positions of a vector.- Logical operators
<,>, ==,!=: Applying these operators on a vector returns a new vector with values TRUE/FALSE for each of the positions of the vector, depending on whether the given values satisfies or not the condition.
length(v3)## [1] 9v4<-1:5
v4>3## [1] FALSE FALSE FALSE TRUE TRUE1.4.3 Lists
Once we have seen vectors we go to explore how objects of type list work. A list is an object similar to a vector with the difference that lists allow to store values of different type. Lists are created using the list(value1, value2, ...) function. For example:
list1 <- list(1,7,'Marcos')
list1
## [[1]]
## [1] 1
##
## [[2]]
## [1] 7
##
## [[3]]
## [1] "Marcos"To access the values stored in the different positions proceed in the same way we did with vectors, ie name[position]:
list1[3]## [[1]]
## [1] "Marcos"We can use the length() function with list too:
length(list1)## [1] 31.4.4 Arrays
Arrays are an extension of vectors, which add additional dimensions to store information. The most common case is the 2-dimensional matrix (rows and columns). To create an array, we use array(values, dimensions). Both values and dimensions are specified using vectors. In the following example we see how to create a matrix with 4 rows and 5 columns, thus containing 20 values, in this case correlative numbers from 1 to 20:
myarray<- array(1:20,dim=c(4,5))
myarray
## [,1] [,2] [,3] [,4] [,5]
## [1,] 1 5 9 13 17
## [2,] 2 6 10 14 18
## [3,] 3 7 11 15 19
## [4,] 4 8 12 16 20To access the stored values we will use a combination of row-and-column positions like matrix[row, col], where row indicates the row postition and col the column one. If we only assign value to one of the coordinates ([row,] or [,col]) we get the vector corresponding to the specified row or column.
myarray[3,2]## [1] 7myarray[3,]## [1] 3 7 11 15 19myarray[,2]## [1] 5 6 7 81.4.5 Data.frame
A data frame is used for storing data tables. It is a list of vectors of equal length. For example, the following variable df is a data frame containing three vectors n, s, b.
n <- c(2, 3, 5)
s <- c("aa", "bb", "cc")
b <- c(TRUE, FALSE, TRUE)
df <- data.frame(n, s, b)
As you can see, the function data.frame() is used to create the data.frame. However, we will seldom use these function to create objects or store data. Normally, we will call an instruction to read text files containing data or call data objects available in some packages.
1.5 Object management
We have seen so far aspects related to the creation of objects. However we should be also know how many objects we have created in our session and how to remove them if necessary. To display all created objects we use ls(). Deleting objects in R is done by the command remove rm(object) and then call to the garbage collector with gc() to free-up the occupied memory.
ls()## [1] "accuracy" "b" "ctable"
## [4] "cv.err" "data" "df"
## [7] "g" "h" "list1"
## [10] "logit" "mod.lm" "mod.logit"
## [13] "mod.logit.pred" "mod.poisson" "mod.pred"
## [16] "myarray" "mylogit" "n"
## [19] "name" "numberOfRows" "obs.pred"
## [22] "ratio" "regression" "regression.cal"
## [25] "regression.val" "rmse" "s"
## [28] "sizeValue" "threshold" "v1"
## [31] "v2" "v3" "v4"
## [34] "val.sample" "x" "xfit"
## [37] "yfit"rm(n)
gc()## used (Mb) gc trigger (Mb) max used (Mb)
## Ncells 1021830 54.6 1978964 105.7 1978964 105.7
## Vcells 2219207 17.0 8565157 65.4 8565157 65.4If we want to removal al the objects we have currently in our working session we can pass a list object containing the names of all objects to the gc() function. If you are thinking on combining gc()and ls()you are right. This would be the way:
rm(list=ls())
gc()
## used (Mb) gc trigger (Mb) max used (Mb)
## Ncells 1017215 54.4 1978964 105.7 1978964 105.7
## Vcells 1875186 14.4 8565157 65.4 8565157 65.41.6 Functions and arguments
Up to this point we have seen and executed some instructions in R, generally oriented to the creation of objects or realization of simple arithmetic operations.
However, we have also executed some function-type statements, such as the length() function. A function can be defined as a group of instructions that takes an input, uses this input to compute other values and returns a result or product. We will not go into very deep details, at least for now. It suffices to know that to execute a function it is enough to invoke the instruction that calls the desired function (length) and to specify the necessary inputs, also knwon as arguments. These inputs are always included between the parentheses of the instruction (length(vector)). If several arguments are needed we separate them usign ,.
Sometimes we can refer to a given argument by using the argument’s name as is the case of the example we saw to delete all the objects in a session rm(list=ls()).
1.7 Scripts in R
So far we have inserted instructions in the console but this is not the most efficient way to work. We will focus on the use of scripts which are an orderder set of instructions. This means we can write a text file with the instructions we want to insert and then run them at once.
RStudio has an script development environment which opens in the top-left window. We can access the scripting window pressing File/New File/R script.
For additional information visit the RStudio support site.
References
R Core Team. 2016. R: A Language and Environment for Statistical Computing. Vienna, Austria: R Foundation for Statistical Computing. https://www.R-project.org/.